NUMERICAL EXAMPLE:
| OPTION A | OPTION B |
| Centrifugal Pump | Piston Pump |
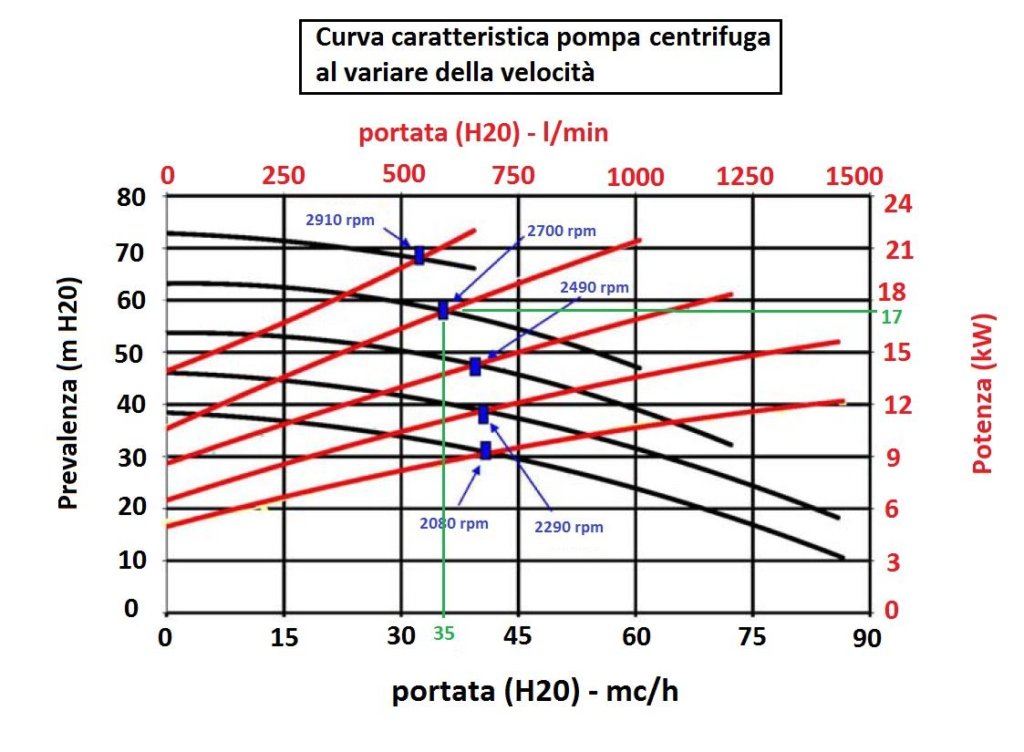
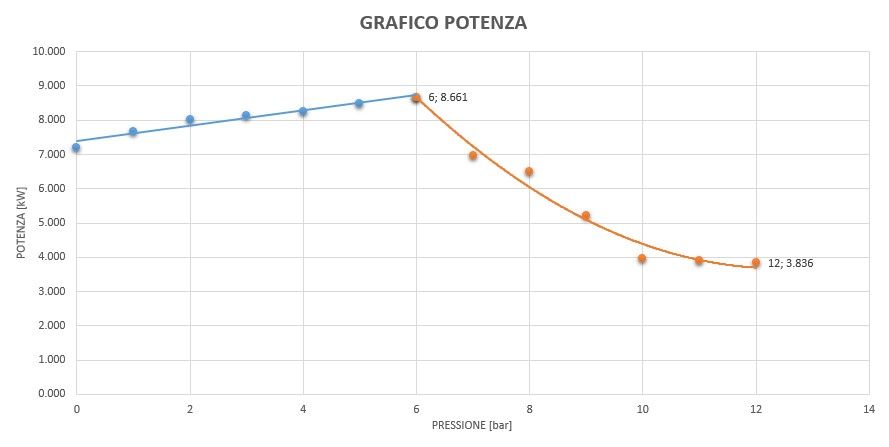
| 35 mc/h 6 bar 17 kW Cost: 6000 € | 30 mc/h 6 bar 8.6 kW Cost: 26000 € |
First, we need to know how much is the (gross) cost of 1 kWh of power.
This depends on which band we belong to, but we can use average values that can be deduced by visiting for example the Area website where you can find the Area annual report / processing with Eurostat data.
Let us find out the gross cost (with taxes) of 1 kWh.
Suppose it is e.g. 0.19 €/kWh
At this point I need to know how many hours per day my system operates and likewise how many days/year in order to obtain the annual hours of operation
Example:
Plant operation: 8h/day – 320 day/year
from which 8*320 = 2560 h/year of plant operation
Pump consumption A:
17 kW * 2560 h = 43520 kWh
Pump B consumption
8.6 kW * 2560 h = 22016 kWh
Pump A energy cost
43520 kWh * 0.19 €/kWh = 8268.80 €
Energy cost pump B
22016 kWh * 0.19 €/kWh = 4183.04 €
Already from this we see that pump B, although it costs more, has an annual energy cost that is half that of pump A. So ultimately, each year with pump B you have € 4085.76 more in your pocket than pump A.
The question is therefore: when is the choice of pump B cheaper than pump A? Simple, just make a projection of the annual costs over a time horizon of say 10 years
INCREMENTAL COST PROJECTION
| YEAR | PUMP (€) | PUMP B (€) |
| 0 | 6000 | 26000 |
| 1 | 14268.80 | 30183.04 |
| 2 | 22537.60 | 34366.08 |
| 3 | 30806.40 | 38549.12 |
| 4 | 39075.20 | 42732.16 |
| 5 | 47344.00 | 46915.20 |
| 6 | 55612.80 | 51098.24 |
| 7 | 63881.60 | 55281.28 |
| 8 | 72150.40 | 59464.32 |
| 9 | 80419.20 | 63647.36 |
| 10 | 88688.00 | 67830.40 |
This mirror is best associated with a simple graph that shows much more clearly what is happening:
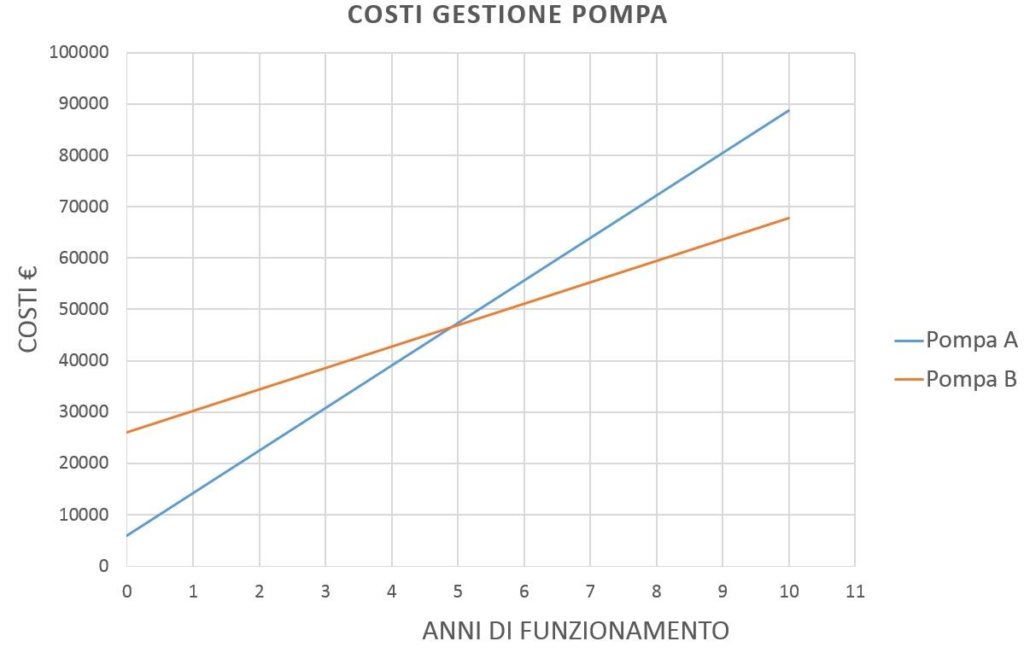
As can be seen, in year 5 the costs of the two solutions are equal. This means that from year 5, if I use Pump B, I save € 4085.76 in energy costs each year.
Since the useful life of a good piston pump if treated well can be up to 20 years, this means that at the end of 20 years I have saved a good € 15*4058.76 = € 60881.4 compared to solution A.
This is done considering 8h of operation per day and with the energy costs just seen. Clearly, the more I use the pump, the wider the range becomes.
The function representing the economic cost of a pump during its operation (apart from the cost of maintenance) is in first approximation a simple straight line whose slope is the annual cost of the pump itself:
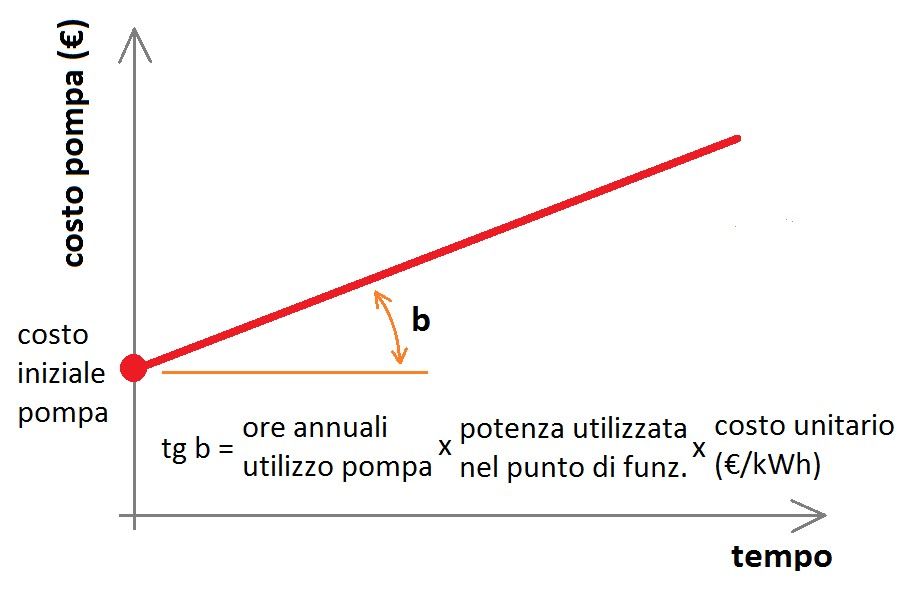
To calculate the break-even point analytically, simply equalise the two straight lines representing pump A and pump B respectively.
cost A = c.iniz.A + tg b1 * t
cost B = c.iniz.B + tg b2 * t
by deriving t I will have that
t = (c.iniz.B – c.iniz.A)/[annual hours pump usage*(pot.A – pot.B)*unit cost €/kWh]
then numerically, with the values of the previous example
t = (26000-6000) € / [2560 h/year * (17 kW – 8.6 kW)* 0.19 €/kWh] = 4.89 year
Here we have analytically found the time frame from which pump B starts to be economically advantageous compared to pump A (4.89 years in our case)